VeryWeather has previously utilised NWP (Numerical Weather Prediction) models to distribute severe weather predictions using trackers and maps to a wide audience within the UK.
We’ve utilised the UKV (Met Office) at 1.5km resolution, Arome (Meteo France) at 1.3km, and HARMONIE (Danish Meteorological Agency) at 2km. These models provide the spatial granularity needed to analyse the chance of severe weather phenomena that driven by local terrain effects and convection-permitting meteorology.
They require hours of computational time, becauase they operate on CPUS (Central Processing Units), that run linear equations, leading to large infrastructure costs for source-providers, and slow turn around times.
We can announce that VeryWeather has harnessed NVIDIA’s Earth-2 framework to develop a custom 1.5km, data-driven artificial intelligence meteorological downscaling model to enable us to predict severe weather events in the UK with much lower resource and compute requirements.
VWHD – VeryWeather High Resolution AI Forecasting System by Data-Driven Downscaling
VWHD has been tailored to reolve detail in weather conditions at a high 1.5km (0.9 mile) resolution.
Our implementation of Earth-2 involves customising model weights to integrate UK terrain, urban-density, and weather patterns.
The model takes coarse output from the ICONEU at 6.3km and utilises Earth-2 to resolve it to 1.5km, outputting meteorological variables such as temperature, wind, fog fraction and precipitation. Outputs also include height level data, for example temperature and wind at 100m AGL (Above Ground Level).
At the time of this announcement, we have developed a regression model for the UK (VWHD-R) and a smaller diffusion nest for the North Midlands and Northern England (VWHD-D-NW). The model outputs are streamed from NVIDA GPUS to an operational viewer, updated 4 times a day to 120 hours at 1.5km resolution.
The model ingests a high resolution snapshot of the UK’s terrain and urban-density, so it’s able to infer sharp temperature and wind outputs that are bounded by these surface characteristics.
The diffusion nest, currently operational for the North Midlands and North West England, utilises CorrDiff-style diffusion to output fine-scale convection, and surface thermodynamic response. This is “part-two” of the model architecture.
VWHD will develop in the next 12 months in the following manner.
Phase 1 (September 2026 to February 2027): Trial of regression outputs with terrain and urban informed surface and height level temperature, wind, and fog fraction (VWHD-R), and a diffusion nest for North West England (VWHD-D-NW).
Phase 2 in 2027: Deployment of precipitation, convection, cloud and other outputs associated with diffusion for the UK domain. (VWHD-D).
The model architecture itself (CorrDiff / StormCast), operates a two-stage process of regression and diffusion. Regression resolves a “most-likely” outcome for each prediction hour, with diffusion able to resolve conditional fine-scale granularity in mesoscale systems. We call this fine-scale granularity stochastic uncertainty. By utilising varying input seeds, we can convert the embedded stochastic uncertainty within the model to different predictions for the same hour, akin to an operational ensemble.
The mapping from NWP (Numerical Weather Prediction) to AI in High Resolution Meteorology
NWP models such as the UKV and Arome utilise surface data like terrain and urban density, but carry out trillions of equations to determine how weather patterns interact with the UK’s varied terrain and land-density to produce output conditions. This makes classic-NWP methods extremely resource and compute heavy, often requiring multiple hours of compute over a large computing cluster.
VWHD-R has demonstrated an ability to infer
VWHD-R infers 1.5km resolution outputs that utilise the high resolution surface state of the UK, capturing 1.5km Urban Heat Island and Terrain Lapse-Rate effects that the low resolution input was unable to capture, for example in figure 2.
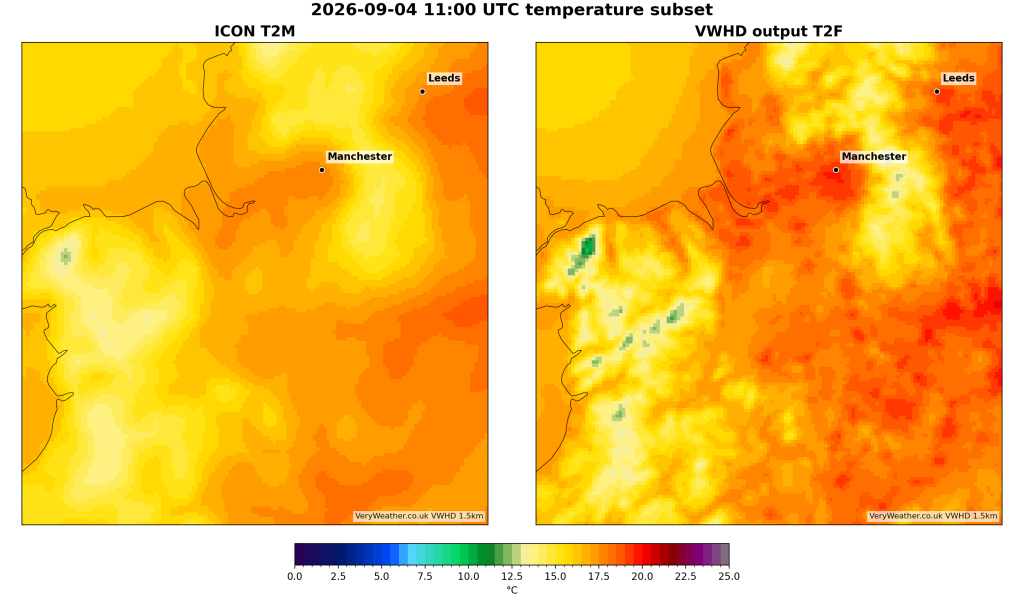
Figure 2., high resolution VWHD output (right), capturing the urban-induced heat in Manchester and Leeds, largely absent in the input ICONEU (left)
A model or a downscaler?
CorrDiff, the architecture harnessed by VWHD, is by mechanism a downscaler. That’s because the broadscale meteorology is provided by ICONEU, which provides lateral boundary conditions (LBC). Then, the model outputs a high resolution prediction, a downscale of the input conditions.
However, VWHD utilises a custom NWP configuration, which acts as a nested NWP model. That configuration allows it to resolve convection-inducing features at 1.5km, such as localised showers and convective uplift. Therefore, although the model is in principle a downscaler, it does so by learning from a nested NWP model that contains added convective-scale information. The model can therefore infer new structure and convection-induced meteorological phenomena that may not exist in the input data. By perturbing the model, we can achieve different realisations of the same forecast. VWHD-D-NW is able to achieve this by initialising the model with different seeds (figure 4).
Speed-ups observed
In training, obtaining an hour’s weather prediction took around 40 minutes, on an AMD EPYC system (a high-performance computing CPU).
We have observed inference times of 0.4 seconds on NVIDIA H100 GPUs for an hour snapshot for the UK domain for regression, indicating several orders of magnitude faster inference times compared to classic NWP, around x6000 faster for VWHD-R. For stage 2, diffusion, inference took around 7 seconds, a 400x speed-up.
The rental cost of a H100 is significantly higher than an AMD EPYC, meaning the actual cost efficiency is around 1000x / 100x, lower than the speed up would suggest for regression and diffusion. This still represents a very significant reduction in resource-demand to produce high resolution forecasts, and models can be fine-tuned over time to improve performance.
The benefit of dynamic input channels at 1.5km resolution
If land-use and ground parameters change between model iterations, the model can utilise these new settings operationally. Some areas could undergo industrialisation or deindustrialisation over time.
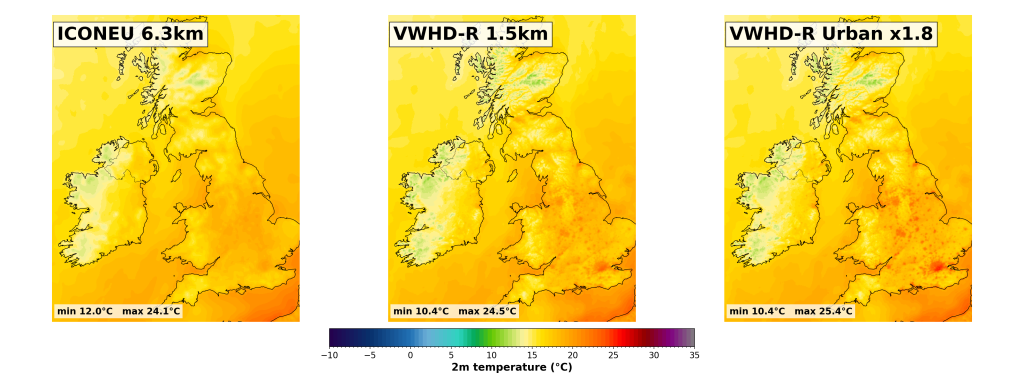
In the example below, we added synthetic urban density to the input, so the model saw much denser urban cores for town and city areas. The temperature of urban cores was about 1-2C higher with additional urban-content compared to the unchanged state, demonstrating that the model is able to ingest surface-states and produce conditioned output.
Model Verification
The model is undergoing an operational trial that will be active between September 2026 and February 2027.
This post contains several documented cases in which model behaviour aligned with operational models to help illustrate the technical points made. However, verification will involve comparing VWHD-R and VWHD-D-NW output to operational high-resolution models, specifically to gauge its ability to replicate the conditional 1.5km structure in meteorological fields that are observed in high-resolution AROME and HARMONIE predictions. This will occur systematically, logging VWHD-R and high-resolution predictions for a period of 6 months, allowing for long-term verification over a large number of weather regimes. That will allow us to provide comparative metrics to validate the performance of VWHD’s reproduction of terrain and urban inducing phenomena, allowing us to fine-tune the model.
The results of the Phase 1 verification analysis will be posted early in 2027.
As the model is in its BETA phase, we must be strict about our guidance on not using the output operationally, neither for commercial or personal purposes.
A few examples of model behaviour
- Heavy snowfall through Manchester and Cheshire on 7th January 2025.
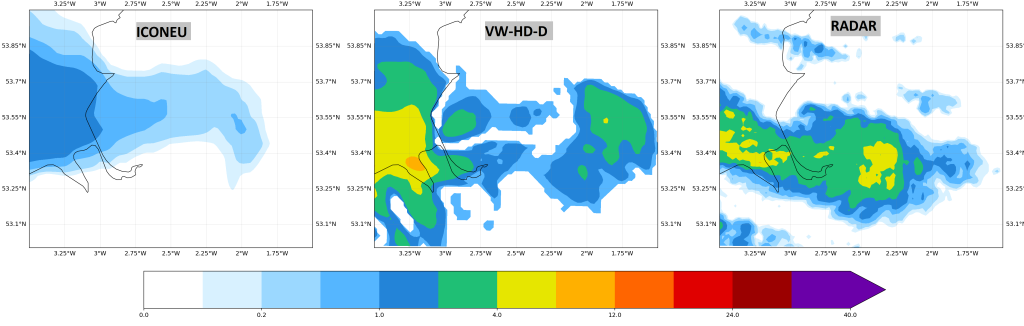
A streamer, a narrow band of heavy precipitation, occurred through Merseyside, Manchester and Cheshire, and produced significant snowfall. Compared to input ICON precipitation, left, the structure and alignment of VWHD-D precipitation appeared tighter and more conformant to radar observation. The model was able to output plausible locations of the shower band, reflecting its learning of convective initiation. It also initiated scattery precipitation to the NW and SW of the band that was somewhat replicated in radar. The ability of diffusion to better-imitate radar texture was observed by many recent CorrDiff-style studies (Nature 2025).
This case was not included in training data.
2. 1st September 2026.
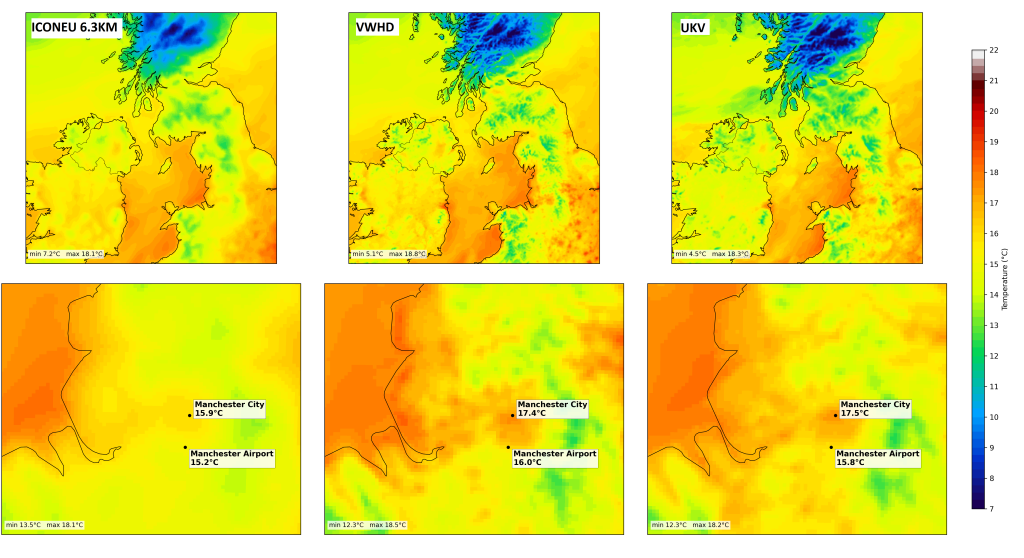
VWHD-R started BETA predictions in late August 2026. During the evening of 1st September 2026, inference was performed for 20z-08z on 2nd. The VWHD improved the skill-score from input ICON for areas of higher urban density, indicating the model has learnt a plausible UHI (Urban Heat Island) response. The MAE (mean absolute error) for urban areas was 0.34C lower between the inferred VWHD and UKV compared to the ICONEU and UKV. The 1.5km urban structures of NW England are evidently resolved in figure X. This case was also not included in training data. The magnitude of the UHI in VWHD-R was more aligned with the UKV than the ICON, with the trend in UHI-magnitude over time also better-following the UKV, indicating the model has learnt an appropriate response to the meteorological setup.
It is important to assert that whilst the model’s output has been compared to the Met Office’s UKV for held-out cases, no UKV data was consumed anywhere in the training of VWHD – it is trained on ICONEU and a high-fidelity high resolution NWP configuration.
What Can You See from VWHD in Phase 1?
The Phase 1 trial will include a deterministic run, 4x a day, to 120 hours lead time, at 1 hour intervals. At 1.5km, 120 hours of lead time 4x a day is significant throughput.
There will also be utilisation of the ICON-EU-EPS ensemble, allowing for a four-ensemble member prediction out to 36 hours lead time, updated 4x a day.
You can view the output on a chart viewer here.
The increased throughput capability is a benefit of running fast GPU-inference. Running NWP to 1.5km in the traditional sense for the aforementioned quantity would require substantially more energy, requiring institutional levels of compute. Therefore, Earth-2 has enabled VeryWeather to produce 1.5km forecasts that would not otherwise be practical.
These are the variables you will be able to see in the viewer:
VWHD-R (Regression)
- Temperature – predicted 2m air temperature.
- Temperature at 50m, 100m and 200m.
- Wind speed – predicted 10m wind speed.
- Wind gust – predicted 10m wind gust.
- Wind speed at 50m, 100m and 200m.
- Wind direction – predicted 10m wind direction.
- Wind Shear, including direction and vertical, 0-200m.
- Convective gust – wind gusts that are a result of convection.
- Fog – the probability of fog in an area.
VWHD-D-NW (North West England Diffusion)
- Precipitation
- Temperature at 2m
- Wind Speed at 10m
- Wind Gust at 10m
Renewables & Energy
Height level predictions
VWHD is able to infer important variables like 0-50m and 0-200m Shear, and near-surface temperature lapse-rate. These variables are important for travel and renewable energy.
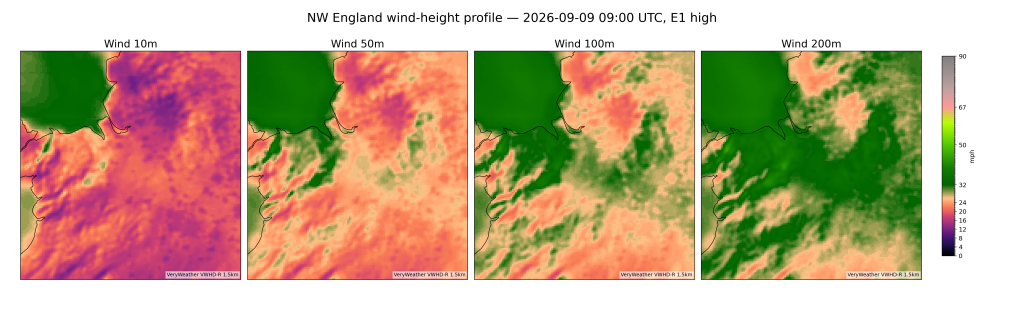
Figure X shows the vertical wind speed profile observed between 10m and 200m. Wind speed increases with height, indicating the model has learnt a coherent vertical speed profile. The height-level response appears to be spatially conditional, with correlation to urban fraction vertically variable and visually terrain-induced. A lower wind speed to urban density correlation at higher altitudes is a sign the model has learnt a dynamic vertical response according to land use, not merely a uniform increase in wind speed.
R value wind speed to urban density – Height Levels – 20260909
At 10m AGL | -0.35
At 50m AGL | -0.33
At 100m AGL | -0.31
At 200m AGL | -0.25
Wind Gust At 10m AGL | -0.25
Conditional terrain response
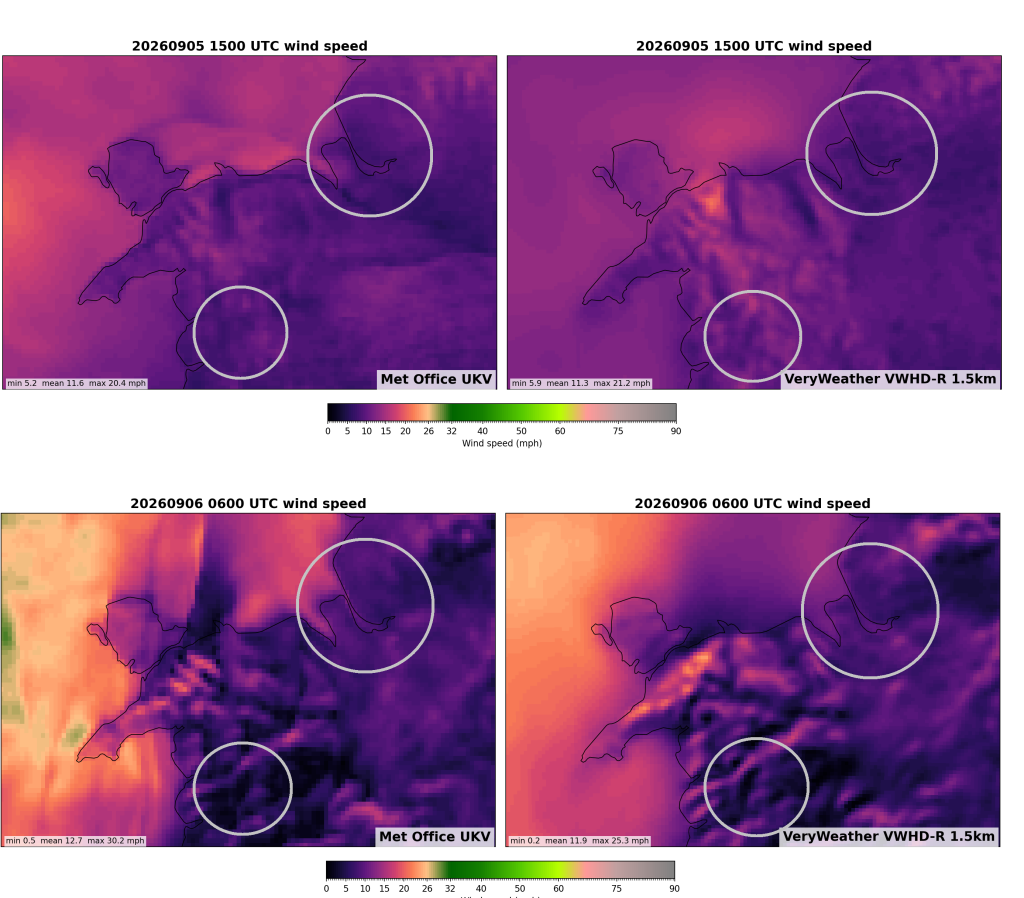
To demonstrate the conditional terrain-wind response observed in VWHD-R, two wind events are compared in figure X. The two events have differing wind directions; 15z has a westerly wind, and 06z has a southerly wind.
It is evident that the model elicits a well-conditioned spatial response in 1.5km wind field alignment. Visually, in both events, the wind speed field predicted by VWHD-R contains numerous terrain-induced features that are present on the UKV, with some localised variations. These are two separate models (UKV and VWHD-R) at 32 to 47 hours lead time, so some variation may not totally be explained by model behaviour. The lower circle is an example of an area where VWHD-R elicited varying terrain response between the two hours, and that variance shows correlation to the UKV predicted wind field. The area to the North West shows a faint urban drag area around Liverpool Bay, present for both hours on both the UKV and VWHD-R.
This indicates that the model has learnt a meteorologically coherent terrain response that is non-uniform, thus conditioned on input wind direction and dynamics. The UKV elicits much more mesoscale detail, with VWHD-R following the broad scale ICON driving mesoscale detail whilst eliciting a 1.5km surface response. VWHD-D does move towards the UKV in addition of mesoscale detail, though the location is slightly offset compared to the UKV. The offset is not necessarily an indicator of model performance, as the two models saw wildly different boundary conditions.
What’s Next?
The trial period to February 2027 will include validation of inferred temperature, wind speed, fog fraction and wind shear against operational models such as the HARMONIE and AROME. As VWHD-R is focused on urban and terrain effects, verification will involve testing whether the model has learnt to correctly conditionally initialise urban effects, and spatially partition terrain effects. VWHD-D’s performance will be validated on its ability to correlate to radar, and retrieve the high resolution frontal and mesoscale detail observed by the HARMONIE and AROME.
Once the trial period concludes, we will publish the full results of our operational validation. This analysis will outline the model’s strengths and edge cases—directly powering the rollout of Phase 2 in early 2027.
Then, we will embark on development of Stage 2, fine-tuning models, and producing VWHD-D-UK, a stochastic diffusion model with ensemble ability for the broader UK area. This will enable not only resolution of terrain and urban detail at 1.5km as VW-HD-R evidently does, but also the fine-scale structure associated with convection-permitting mesoscale meteorological systems at 1.5km.
VeryWeather may post charts of VWHD output where it predicts severe weather. This will form part of Phase 1 usage. Though all Phase 1 uses on VeryWeather should read the following disclaimer.
[Check out the VWHD viewer here]
Disclaimer:
The output of VWHD is, whilst this notice is visible, experimental and provided for research, testing, and evaluation purposes only. It is not intended for operational or commercial use, or day-to-day personal safety and travel decisions. Always consult official national meteorological services and government agencies for statutory weather warnings and safety advice.